This week, a Twitter debate about traffic modelling has inspired me to lift the lid on a couple of the shortcomings and sharp practices used in traffic engineering where the use of computer modelling is concerned.
Before I start, there will be opinion in this post and I encourage you to do your own research, ask difficult questions and challenge assumptions; because as any computer expert will tell you "garbage in, garbage out". I am not an expert in the intricacies of traffic modelling, but I have rumbled cheats over the years (more on that later).
By modelling, I don't of mean mock-ups in Lego (although Copenhagen is nicer than London for cycling), I am referring to computer modelling of traffic which is often used to test different road layouts. In my opinion, it is often an utter waste of time when a traffic authority has a policy of prioritising motorised traffic (yes, Transport for London, I can see you there hiding at the back).
There are lots of different pieces of software out there that help us design our schemes which is really useful and is not in itself a bad thing. The problem is what people use the data for, or how they manipulate it, or what they are trying to show and for which audience.
 Let's start with very simple example which is based on a real investigation I dealt with a few years back (it still haunts me). This story can be applied to countless locations in the UK.
We have a signalised crossroads type junction where an 'A' road runs east-west with two local distributor roads (which are probably just as busy at peak) coming in from the north and south.
Each road is single carriageway and where the road approaches the junction, it flares out into two narrow lanes. In reality, each arm has an advanced cycle stop line (no feeder lanes), but that is not important for this example.
In all cases, the left lane is left / ahead and the right lane is right only. For pedestrians, there are no green men at all, but a narrow refuge in each arm. The traffic signal staging is a doddle. the east-west arms run together, then the north-south arms run together and that's it. Pedestrians try and leg it on the all red signals between opposing stages while drivers in the middle finish their right turns!
The investigation I was involved with was simple - what was the feasibility of providing green men (pelicans) at the crossing. So, we needed to model the junction and that involved spending a ton of money getting traffic and pedestrian counts for the junction at various times of the day, sticking the results in the computer and then modelling different layouts. I knew that in traffic capacity terms, we couldn't make it work as the area is always stuffed at peak times. I knew councillors wouldn't go for it as it would stuff the junction for drivers even more. But, we pressed on, I thought it was important.
We modelled three things. Sticking in a new stage for all-round green men (all traffic held on red); widening the junction to provide staggered green men crossings to allow pedestrians to move when traffic is not in conflict with them; ripping the lot out and sticking in a roundabout with zebra crossings at each arm.
We did the modelling for the two signal options with LinSig, which I won't even attempt to explain in detail (as the intricacies are mainly beyond me), but it allowed the data to be input to create a model which can then be used to test different arrangements. The base method of control was tested to see what the capacity was at the time and it showed that things were running pretty much at capacity (for traffic), with significant traffic queues at peak times - which told us what we knew from observation and so the model was working.
Junction capacity is an interesting concept to get one's head around. When looking at a signalised junction in isolation, for every cycle of the signals, there is a theoretical amount of traffic (including pedestrians and cyclists) that can be stuffed through. The trouble is, that when a junction runs beyond 90% of theoretical capacity, the flow starts to break down and capacity drops off. For those in the know, this is like a water pipe running just under full. The inside of the pipe exerts friction on the water and it can be shown (by that there mathematics) that the point where the pipe is just under full is actually more efficient than full, because of the little space at the top where friction doesn't act on the water.
Traffic is the same concept. The "friction" in this case will be things like people hesitating at a gap rather than turning, traffic blocking the exit from the junction, a large vehicle turning (if the turn is tight - classic issue in constrained city sites) and even things like pedestrians being invited to cross by a driver. So at 100%, the demand on the junction and its capacity or equal and so it is full up (i.e. saturated). The relationship between demand and capacity can be expressed as a percentage know as Degree of Saturation (DoS) and hence the magical 90% figure. Beyond this, the flow gets broken down as explained above. Strangely, it is also possible to exceed 100% of the theoretical capacity.
The 100% will have things like safety built in where it is assumed that people obey the signals and take sensible gaps to turn. Locations exceeding 100% are where people are regularly (every cycle) going through amber and red signals, taking very small gaps to turn or driving to closely to the vehicle in front. This will very much depend on the junction and the types of drivers, but is something which can be observed on busy commuter routes where the assumption will be that generally the same people use it every day and pedestrians are often excluded from having green men unless they can be mixed in with the signal phases.
To increase capacity, you cannot just add green time as the overall cycle time increases leading to congestion. So, like a pipe of a certain size, a junction will have an optimum capacity and to increase the flow, you need to increase the size of the junction to cope (like a bigger pipe for more water flow). Of course, capacity can be increased if demand is reduced and the now spare capacity can be given to other modes - traffic falling off within inner-London?
Long-winded, but I think useful to know. For the roundabout option, ARCADY was used, which again uses flow data, plus the physical layout of a roundabout such as number of lanes into and out of the junction, lane width and so on. For roundabouts, we use Ratio of Flow to Capacity (RFC) to see if the junction will work using the magic number of 0.85 as the threshold. Essentially 85% of the theoretical capacity is the maximum flow rate. The zebra crossing component is a nightmare to model as we don't have pedestrians crossing in nice little groups as we would for green men and so there is a fair bit of assumption. Of course, people crossing in large numbers on one arm for more than a few seconds would lock up the roundabout.
So, the results showed that all three options would increase queue length to the junction at peak times with the roundabout / zebra combination being particularly bad. So, what did I present to councillors? Well, I suggested that the the roundabout was out and the staggered green men would be a large land take and therefore cost (moving buried utilities and so on) The staggered option made the junction larger and off-set some of the congestion created by the green men. To have completely mitigated the issue, the junction would have been huge and there was not enough land available! The introduction of green men on all arms was the simplest, but would have created chaos for drivers.
The summing up was that on the one hand the junction could be left alone, as when looking at the casualty-rate, green men would be unlikely to affect the number off pedestrians being hit each year; yes, sadly, we do deal in cold harsh numbers and pedestrians will statistically get hit at signalised junctions as there will be drivers jumping red lights against green men and pedestrians will cross on a red man against a green traffic signal. At this junction, the actual rate was about the same as would be predicted for signals. Therefore, the do nothing option would mean drivers are not impacted more then was current. On the other hand, the junction is horrible for people to cross and green men would allow people to cross easily, but at the expense of traffic congestion. This is pretty much Hobson's choice as the councillors didn't fancy causing any more traffic congestion there remains no green men at the junction today.
I stated earlier that this junction haunts me. Not because I get complaints from pedestrians (who put up with most things most of the time), no because in hindsight, I should have been more pushy. Of course, my job is to be objective and impartial in giving advice. I know that I would have been on a loser and probably criticised, but perhaps I should have ramped up the issues facing pedestrians?
This is a classic example of modelling being a waste of time because I knew the green men on all arms would be the cheapest and simplest option to deliver and I knew traffic queues would be worse. For the councillors who read and understood the report, they knew the same as me. So, why didn't I just save a load of money and propose green men and to hell with traffic flow? I suppose it is the game that we play. Do loads of work, write a technical report and go with the charade of explaining the implications to committee because if we just put the scheme in and it annoyed drivers, we would be asked why didn't we foresee the problems. Why didn't we model it?
In this case, the only winner was the consultant that did the modelling (and I am not criticising them for that, they looked at everything and earned their fee). It is a charade we go through and I think that in many cases those thinking that a situation needs modelling, are half expecting there to be capacity issues. Wouldn't it be simpler and cheaper for politicians to start from the point of view that they wish to prioritise walking (and indeed cycling) and where there is no space to build, admit that this will be at the expense of drivers. No modelling, no arguments, just get on and build it. OK, the flip-side is to sod non-drivers which this country has a great tradition of doing - but at least the public will know where they stand and the politicians will not be able to hide behind a technical report.
Of course, I do modelling some disservice. It is possible to create very complex layouts and test them and some of the software is very clever indeed. VISSIM, for example, can create 3D virtual layouts which show little cars and buses driving around the model, cyclists pootling along and pedestrians crossing the road. I have seen VISSIM running on junctions I know well and it is quite spooky. This is the world of micro-simulation and could be a whole post in itself (by someone else who understands it!).
Modelling allows one to test ideas and optimise existing layouts, but it is not a magic spell that will give you extra highway space and people need to bear this in mind. You might be able to tweak the junction today to improve capacity based on today's flows, but if those flows change or traffic grows, your advantage has gone. I have worked on another junction in a busy town centre (which has green men) where the conclusion is that unless demand decreases, we are stuck with the congestion. We looked at widening the road which reduced congestion, but it meant footways were lost to tarmac and to be fair to the councillors I presented the findings too, they wanted to prioritise pedestrian space and so we left things alone.
So that is the nice end of the stick, the plucky local authority engineer doing his best knowing that any argument to provide for pedestrians at the expense of motorists can be like farting into the wind or the micro-simulation nerds (in the nicest possible way) who can do amazing things with computers. What is the nasty end of the stick? The foul underbelly of highways if you will?
Well, that would be developers. Now, developers are not necessarily born evil, some are very nice indeed. But some have hearts as black as their stinking souls and even worse are their unholy consultants. Before the saintly consultants protest (they may even read this blog!), I am not having a pop at you, but I am not naming names - they all know who they are! So, what do the naughty ones get up to?
From the developer's point of view, the time between buying land and selling homes or letting units is a temporal money pit. Time is literally money. Before building can start, the developer needs to get planning permission and as part of the planning application, a transport statement (TS) or transport assessment (TA) must be prepared. At the cynical end, the TS / TA must show that the development won't stuff up the roads as a result (for traffic as usual). At the enlightened end, it can positively enhance the design and value of the development.
A TS will tend to be very light, support modest schemes, give basic and sensible facts. It is unlikely that a scheme needing a TS will create any major issues. A TA is a different animal. They can be the thickest document of a planning application. As well as summaries and useful information, they will have appendices of bus and train timetables, walking routes that Sherpas would be proud of and they always contain reams of computer prints showing traffic flows through junctions. Do you know what, I have never read a TA which admits a scheme will cause a problem to the road network and I have read an awful lot.
If I am a consultant working on a planning application, my job is to get my client its planning permission, or at least show there are no highways and transport impacts. Say you are considering a new development without parking as it is in a city centre with parking controls. At worst, the development generates refuse collections and the odd delivery. The impact will be more demand on non-car modes and so cumulative developments or a single large one can mean a higher frequency bus route or even a new railway station. Where car parking is provided (depending on local planning policies), it will generate vehicle movements and this will impact on junctions or create conflicts where the site is accessed.
Consultants will always want to show there is spare capacity (remember DoS and RFC for junctions) and their client's scheme will not make a junction exceed capacity. So, what are the tricks used in the traffic modelling? Well, they can undertake traffic surveys when traffic flows are lower such as over the summer (they either didn't leave enough time to undertake the surveys or they are trying it on). They can look at the peak flows and top or tail the data so some of the peak is conveniently missed (e.g, they report 8am to 9am, when the real peak is 7:30am to 8:30am). They tweak the physical attributes of the models making lanes a little wider than they are or radii a little larger to make flows a bit smoother.
They also like to bury DoS or RFC information in the data appendix and that is one of the first things I read! You can quite often find the magic figures of 90% and 0.85 being exceeded, but they get averaged out in summaries and things seem fine at a glance. I have prepared evidence for planning appeals which includes dissecting appendix data and it does make one's brain hurt. The good consultants play things straight and advise their client early on and good developers make changes to their plans or admit there are going to be issues, but propose physical mitigation up front and good on them. In some cases a planning committee may decide to accept congestion being created if all of the other issues are positive or it suits the ruling administration's policies or plans.
OK, enough of the theoretical capacity arguments, what about kerbs and tarmac I hear you scream? Before we hit the streets we need to draw up plans. My office uses AutoCAD to draw up scheme plans (other design packages are available) and it is a fantastic tool. We also use Autotrack which is swept path analysis software (I will come back to it in a bit). AutoCAD is not just about pretty pictures, it allows schemes to be constructed with a real world layout using real-world coordinates. We design things tied into the Ordnance Survey eastings and northings system which your smartphone GPS can give you. If we have an OS map in AutoCAD, we can overlay our designs in a model of the real world.
Anything slightly complicated will need a survey and so you get a team of surveyors in, they pick up all the details on site with clever and expensive GPS-enabled kit. They can link it to ground penetrating radar (GPR) to pick up the line and depth of buried services (which can also include tracing pipes with a radiosonde which is pushed through pipes emitting a signal). It allows us to know if there are clashes with shallow services if we are moving kerbs or installing foundations - cool stuff indeed.
Of course, this is all open to abuse. One of the wheezes is to change the scale of the real world model so that there appears to be more space than there is and so shows that the layout fits. It is not until things get to site does the problem get discovered as the models stay in the designer's computer and get printed out for the groundworks contractor with a "do not scale" note (which is universally ignored!). The other bit of naughtiness is dimensioning. AutoCAD can dimension things for you and will tell not lies, but what if your parking bay is not quite wide enough? That's OK, we can just over type the dimension with the "right" measurement. Your 1.6 metre wide on-street parking bay, now measures a wonderful 2 metres! If things are space critical or there is a whiff of suspicion, we ask for drawings in digital AutoCAD format. We can check for anomalies and it is amazing how some consultants suddenly get very protective of their intellectual property and only want to issue a PDF or hard copy!
Back to Autotrack. When you have designed your new kerb line and you have missed the buried utilities, it is quite nice to check that vehicles can use it. Autotrack allows you to drive little cars and buses around your layout (or follow paths drawn by you) where you can check there is space. The model shows the position of wheels and vehicle bodies as it moves and so is known as swept path analysis. How can anyone cheat which such benign technology?
Well, when you set up your test vehicle, there are a whole load of parameters to play with. The two best ones to tinker with are forward speed and lock to lock time. Imagine you have a signalised junction with a left turn that is a bit tight and it is on a bus route. A tight turn means that the bus drivers need to slow down to make the turn, but this reduces the amount of traffic that can get through (as they are stuck behind a bus) and so the capacity is compromised.
If the swept path model is run at "normal" traffic speed, the bus will not be able to fit round the turn without bouncing over the footway, or a traffic island or whatever. But, if you reduce the forward speed to a crawl and make the lock to lock time very quick, that bus will now appear to glide through (just don't tell the guy doing the capacity modelling).
Lock to lock time is interesting. Most people have never driven a large vehicle (I have!) in a constrained urban area. There is a lot to think about when you drive a large vehicle, but one of the key issues is it takes a while to turn the steering wheel from fully in one direction to another. You also have body overhanging (worse for buses) and so the body sweeps a larger area than the wheels so you might need to slow down.
A car with power steering is easy to turn corners with, just whip the steering wheel round. With a large vehicle the power steering is pretty much a necessity, but it takes a bit longer to move the steering wheel than a car. When going round a corner, it can take a bit of time and effort to point the wheels the right way (you will now watch the driver the next time you get the bus). As the vehicle is large, there is a lot of it to get round the corner and the slower you go, the easier it is. So, a very slow forward speed and unnaturally quick lock to lock time will show that the kerb line is fine. In reality, the real world driver will struggle!
All of this is linked. Engineers are there to solve problems and with highways, it tends to be trying to squeeze as much as possible from the asset. Cheating and naughtiness aside, I think the use of computers is fantastic and allows us to do things unheard of, even a few years ago. But, all too often, we take the blame for not sorting out congestion (well, you just rephase the lights don't you) or making life better for pedestrians and cyclists (and the criticism is partly fair). But, we cannot work miracles. Our designs cannot bend space and time and they cannot create new space where there is none. At this point, the politicians need to take responsibility and not hide behind technical reports or their staff.
With the announcement over the summer to throw billions at creating motorised traffic capacity and the news this week that Local Transport Bodies are ignoring sustainable travel, the outcome may well be making inter-urban car use easier, but this will be at the continued expense of our town and city centres in terms of congestion, deaths, injuries, pollution, transport poverty and all of financial impacts resulting. The last time I looked, you cannot stick that in your model!
By modelling, I don't of mean mock-ups in Lego (although Copenhagen is nicer than London for cycling), I am referring to computer modelling of traffic which is often used to test different road layouts. In my opinion, it is often an utter waste of time when a traffic authority has a policy of prioritising motorised traffic (yes, Transport for London, I can see you there hiding at the back).
There are lots of different pieces of software out there that help us design our schemes which is really useful and is not in itself a bad thing. The problem is what people use the data for, or how they manipulate it, or what they are trying to show and for which audience.

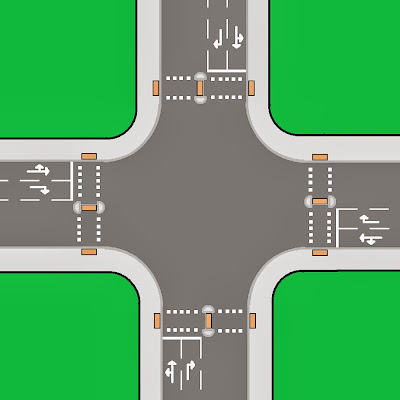
We have a signalised crossroads type junction where an 'A' road runs east-west with two local distributor roads (which are probably just as busy at peak) coming in from the north and south.
Each road is single carriageway and where the road approaches the junction, it flares out into two narrow lanes. In reality, each arm has an advanced cycle stop line (no feeder lanes), but that is not important for this example.
In all cases, the left lane is left / ahead and the right lane is right only. For pedestrians, there are no green men at all, but a narrow refuge in each arm. The traffic signal staging is a doddle. the east-west arms run together, then the north-south arms run together and that's it. Pedestrians try and leg it on the all red signals between opposing stages while drivers in the middle finish their right turns!
The investigation I was involved with was simple - what was the feasibility of providing green men (pelicans) at the crossing. So, we needed to model the junction and that involved spending a ton of money getting traffic and pedestrian counts for the junction at various times of the day, sticking the results in the computer and then modelling different layouts. I knew that in traffic capacity terms, we couldn't make it work as the area is always stuffed at peak times. I knew councillors wouldn't go for it as it would stuff the junction for drivers even more. But, we pressed on, I thought it was important.
.JPG) |
| Staggered pelican crossings are often used to maintain vehicle capacity over pedestrian comfort and convenience. |
We did the modelling for the two signal options with LinSig, which I won't even attempt to explain in detail (as the intricacies are mainly beyond me), but it allowed the data to be input to create a model which can then be used to test different arrangements. The base method of control was tested to see what the capacity was at the time and it showed that things were running pretty much at capacity (for traffic), with significant traffic queues at peak times - which told us what we knew from observation and so the model was working.
Junction capacity is an interesting concept to get one's head around. When looking at a signalised junction in isolation, for every cycle of the signals, there is a theoretical amount of traffic (including pedestrians and cyclists) that can be stuffed through. The trouble is, that when a junction runs beyond 90% of theoretical capacity, the flow starts to break down and capacity drops off. For those in the know, this is like a water pipe running just under full. The inside of the pipe exerts friction on the water and it can be shown (by that there mathematics) that the point where the pipe is just under full is actually more efficient than full, because of the little space at the top where friction doesn't act on the water.
Traffic is the same concept. The "friction" in this case will be things like people hesitating at a gap rather than turning, traffic blocking the exit from the junction, a large vehicle turning (if the turn is tight - classic issue in constrained city sites) and even things like pedestrians being invited to cross by a driver. So at 100%, the demand on the junction and its capacity or equal and so it is full up (i.e. saturated). The relationship between demand and capacity can be expressed as a percentage know as Degree of Saturation (DoS) and hence the magical 90% figure. Beyond this, the flow gets broken down as explained above. Strangely, it is also possible to exceed 100% of the theoretical capacity.
The 100% will have things like safety built in where it is assumed that people obey the signals and take sensible gaps to turn. Locations exceeding 100% are where people are regularly (every cycle) going through amber and red signals, taking very small gaps to turn or driving to closely to the vehicle in front. This will very much depend on the junction and the types of drivers, but is something which can be observed on busy commuter routes where the assumption will be that generally the same people use it every day and pedestrians are often excluded from having green men unless they can be mixed in with the signal phases.
 |
| This road is stuffed. The only way to improve capacity is to add traffic lanes. Bye bye trees, front gardens and possibly buildings. Hello more pollution, noise, crashes and eventually, more lanes of stationary traffic. Would protected cycle tracks reduce demand and so increase capacity? |
Long-winded, but I think useful to know. For the roundabout option, ARCADY was used, which again uses flow data, plus the physical layout of a roundabout such as number of lanes into and out of the junction, lane width and so on. For roundabouts, we use Ratio of Flow to Capacity (RFC) to see if the junction will work using the magic number of 0.85 as the threshold. Essentially 85% of the theoretical capacity is the maximum flow rate. The zebra crossing component is a nightmare to model as we don't have pedestrians crossing in nice little groups as we would for green men and so there is a fair bit of assumption. Of course, people crossing in large numbers on one arm for more than a few seconds would lock up the roundabout.
So, the results showed that all three options would increase queue length to the junction at peak times with the roundabout / zebra combination being particularly bad. So, what did I present to councillors? Well, I suggested that the the roundabout was out and the staggered green men would be a large land take and therefore cost (moving buried utilities and so on) The staggered option made the junction larger and off-set some of the congestion created by the green men. To have completely mitigated the issue, the junction would have been huge and there was not enough land available! The introduction of green men on all arms was the simplest, but would have created chaos for drivers.
The summing up was that on the one hand the junction could be left alone, as when looking at the casualty-rate, green men would be unlikely to affect the number off pedestrians being hit each year; yes, sadly, we do deal in cold harsh numbers and pedestrians will statistically get hit at signalised junctions as there will be drivers jumping red lights against green men and pedestrians will cross on a red man against a green traffic signal. At this junction, the actual rate was about the same as would be predicted for signals. Therefore, the do nothing option would mean drivers are not impacted more then was current. On the other hand, the junction is horrible for people to cross and green men would allow people to cross easily, but at the expense of traffic congestion. This is pretty much Hobson's choice as the councillors didn't fancy causing any more traffic congestion there remains no green men at the junction today.
I stated earlier that this junction haunts me. Not because I get complaints from pedestrians (who put up with most things most of the time), no because in hindsight, I should have been more pushy. Of course, my job is to be objective and impartial in giving advice. I know that I would have been on a loser and probably criticised, but perhaps I should have ramped up the issues facing pedestrians?
 |
| Traffic capacity reduced to create space for protected cycling. I bet this wasn't modelled, it just took political will to shift the status quo. |
In this case, the only winner was the consultant that did the modelling (and I am not criticising them for that, they looked at everything and earned their fee). It is a charade we go through and I think that in many cases those thinking that a situation needs modelling, are half expecting there to be capacity issues. Wouldn't it be simpler and cheaper for politicians to start from the point of view that they wish to prioritise walking (and indeed cycling) and where there is no space to build, admit that this will be at the expense of drivers. No modelling, no arguments, just get on and build it. OK, the flip-side is to sod non-drivers which this country has a great tradition of doing - but at least the public will know where they stand and the politicians will not be able to hide behind a technical report.
Of course, I do modelling some disservice. It is possible to create very complex layouts and test them and some of the software is very clever indeed. VISSIM, for example, can create 3D virtual layouts which show little cars and buses driving around the model, cyclists pootling along and pedestrians crossing the road. I have seen VISSIM running on junctions I know well and it is quite spooky. This is the world of micro-simulation and could be a whole post in itself (by someone else who understands it!).
Modelling allows one to test ideas and optimise existing layouts, but it is not a magic spell that will give you extra highway space and people need to bear this in mind. You might be able to tweak the junction today to improve capacity based on today's flows, but if those flows change or traffic grows, your advantage has gone. I have worked on another junction in a busy town centre (which has green men) where the conclusion is that unless demand decreases, we are stuck with the congestion. We looked at widening the road which reduced congestion, but it meant footways were lost to tarmac and to be fair to the councillors I presented the findings too, they wanted to prioritise pedestrian space and so we left things alone.
So that is the nice end of the stick, the plucky local authority engineer doing his best knowing that any argument to provide for pedestrians at the expense of motorists can be like farting into the wind or the micro-simulation nerds (in the nicest possible way) who can do amazing things with computers. What is the nasty end of the stick? The foul underbelly of highways if you will?
Well, that would be developers. Now, developers are not necessarily born evil, some are very nice indeed. But some have hearts as black as their stinking souls and even worse are their unholy consultants. Before the saintly consultants protest (they may even read this blog!), I am not having a pop at you, but I am not naming names - they all know who they are! So, what do the naughty ones get up to?
 |
| Cribbs Causeway, Bristol. A veritable shopping city. I bet the TA was enormous, the roads were nicely modelled and it has had no negative impact on the city at all. Image Google Maps. |
A TS will tend to be very light, support modest schemes, give basic and sensible facts. It is unlikely that a scheme needing a TS will create any major issues. A TA is a different animal. They can be the thickest document of a planning application. As well as summaries and useful information, they will have appendices of bus and train timetables, walking routes that Sherpas would be proud of and they always contain reams of computer prints showing traffic flows through junctions. Do you know what, I have never read a TA which admits a scheme will cause a problem to the road network and I have read an awful lot.
If I am a consultant working on a planning application, my job is to get my client its planning permission, or at least show there are no highways and transport impacts. Say you are considering a new development without parking as it is in a city centre with parking controls. At worst, the development generates refuse collections and the odd delivery. The impact will be more demand on non-car modes and so cumulative developments or a single large one can mean a higher frequency bus route or even a new railway station. Where car parking is provided (depending on local planning policies), it will generate vehicle movements and this will impact on junctions or create conflicts where the site is accessed.
Consultants will always want to show there is spare capacity (remember DoS and RFC for junctions) and their client's scheme will not make a junction exceed capacity. So, what are the tricks used in the traffic modelling? Well, they can undertake traffic surveys when traffic flows are lower such as over the summer (they either didn't leave enough time to undertake the surveys or they are trying it on). They can look at the peak flows and top or tail the data so some of the peak is conveniently missed (e.g, they report 8am to 9am, when the real peak is 7:30am to 8:30am). They tweak the physical attributes of the models making lanes a little wider than they are or radii a little larger to make flows a bit smoother.
They also like to bury DoS or RFC information in the data appendix and that is one of the first things I read! You can quite often find the magic figures of 90% and 0.85 being exceeded, but they get averaged out in summaries and things seem fine at a glance. I have prepared evidence for planning appeals which includes dissecting appendix data and it does make one's brain hurt. The good consultants play things straight and advise their client early on and good developers make changes to their plans or admit there are going to be issues, but propose physical mitigation up front and good on them. In some cases a planning committee may decide to accept congestion being created if all of the other issues are positive or it suits the ruling administration's policies or plans.
OK, enough of the theoretical capacity arguments, what about kerbs and tarmac I hear you scream? Before we hit the streets we need to draw up plans. My office uses AutoCAD to draw up scheme plans (other design packages are available) and it is a fantastic tool. We also use Autotrack which is swept path analysis software (I will come back to it in a bit). AutoCAD is not just about pretty pictures, it allows schemes to be constructed with a real world layout using real-world coordinates. We design things tied into the Ordnance Survey eastings and northings system which your smartphone GPS can give you. If we have an OS map in AutoCAD, we can overlay our designs in a model of the real world.
Anything slightly complicated will need a survey and so you get a team of surveyors in, they pick up all the details on site with clever and expensive GPS-enabled kit. They can link it to ground penetrating radar (GPR) to pick up the line and depth of buried services (which can also include tracing pipes with a radiosonde which is pushed through pipes emitting a signal). It allows us to know if there are clashes with shallow services if we are moving kerbs or installing foundations - cool stuff indeed.
Of course, this is all open to abuse. One of the wheezes is to change the scale of the real world model so that there appears to be more space than there is and so shows that the layout fits. It is not until things get to site does the problem get discovered as the models stay in the designer's computer and get printed out for the groundworks contractor with a "do not scale" note (which is universally ignored!). The other bit of naughtiness is dimensioning. AutoCAD can dimension things for you and will tell not lies, but what if your parking bay is not quite wide enough? That's OK, we can just over type the dimension with the "right" measurement. Your 1.6 metre wide on-street parking bay, now measures a wonderful 2 metres! If things are space critical or there is a whiff of suspicion, we ask for drawings in digital AutoCAD format. We can check for anomalies and it is amazing how some consultants suddenly get very protective of their intellectual property and only want to issue a PDF or hard copy!
.jpg) |
| The excellent Autotrack in action. Image from Savoy Computing. |
Well, when you set up your test vehicle, there are a whole load of parameters to play with. The two best ones to tinker with are forward speed and lock to lock time. Imagine you have a signalised junction with a left turn that is a bit tight and it is on a bus route. A tight turn means that the bus drivers need to slow down to make the turn, but this reduces the amount of traffic that can get through (as they are stuck behind a bus) and so the capacity is compromised.
If the swept path model is run at "normal" traffic speed, the bus will not be able to fit round the turn without bouncing over the footway, or a traffic island or whatever. But, if you reduce the forward speed to a crawl and make the lock to lock time very quick, that bus will now appear to glide through (just don't tell the guy doing the capacity modelling).
Lock to lock time is interesting. Most people have never driven a large vehicle (I have!) in a constrained urban area. There is a lot to think about when you drive a large vehicle, but one of the key issues is it takes a while to turn the steering wheel from fully in one direction to another. You also have body overhanging (worse for buses) and so the body sweeps a larger area than the wheels so you might need to slow down.
A car with power steering is easy to turn corners with, just whip the steering wheel round. With a large vehicle the power steering is pretty much a necessity, but it takes a bit longer to move the steering wheel than a car. When going round a corner, it can take a bit of time and effort to point the wheels the right way (you will now watch the driver the next time you get the bus). As the vehicle is large, there is a lot of it to get round the corner and the slower you go, the easier it is. So, a very slow forward speed and unnaturally quick lock to lock time will show that the kerb line is fine. In reality, the real world driver will struggle!
All of this is linked. Engineers are there to solve problems and with highways, it tends to be trying to squeeze as much as possible from the asset. Cheating and naughtiness aside, I think the use of computers is fantastic and allows us to do things unheard of, even a few years ago. But, all too often, we take the blame for not sorting out congestion (well, you just rephase the lights don't you) or making life better for pedestrians and cyclists (and the criticism is partly fair). But, we cannot work miracles. Our designs cannot bend space and time and they cannot create new space where there is none. At this point, the politicians need to take responsibility and not hide behind technical reports or their staff.
With the announcement over the summer to throw billions at creating motorised traffic capacity and the news this week that Local Transport Bodies are ignoring sustainable travel, the outcome may well be making inter-urban car use easier, but this will be at the continued expense of our town and city centres in terms of congestion, deaths, injuries, pollution, transport poverty and all of financial impacts resulting. The last time I looked, you cannot stick that in your model!

.JPG)

.JPG)


